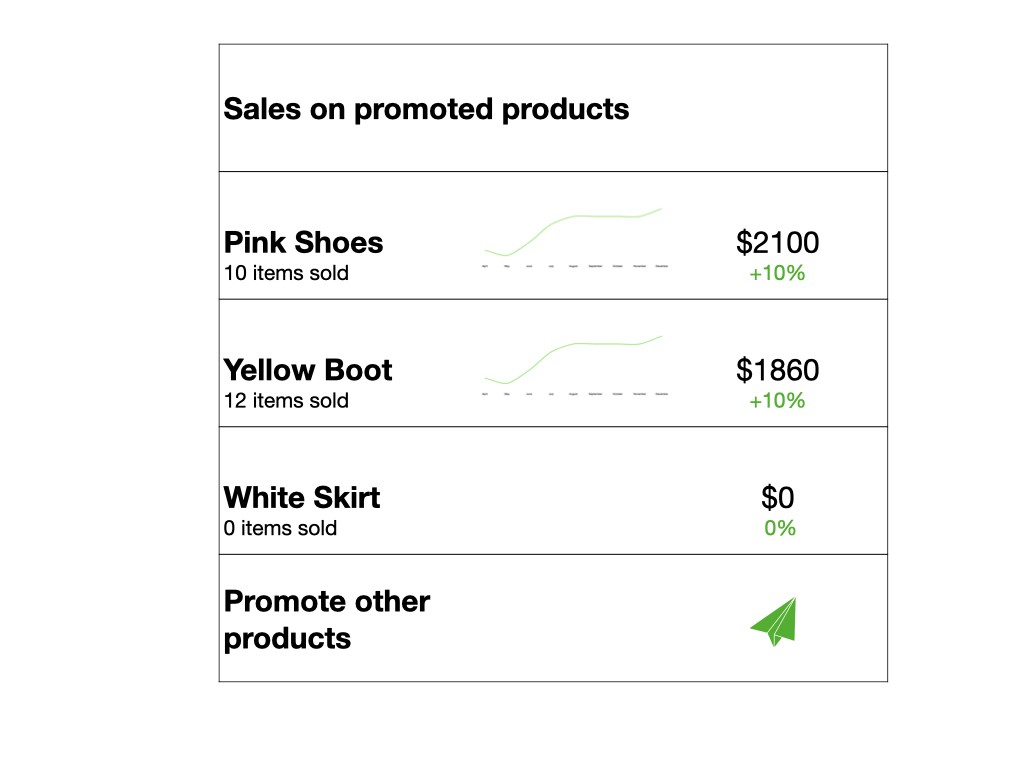
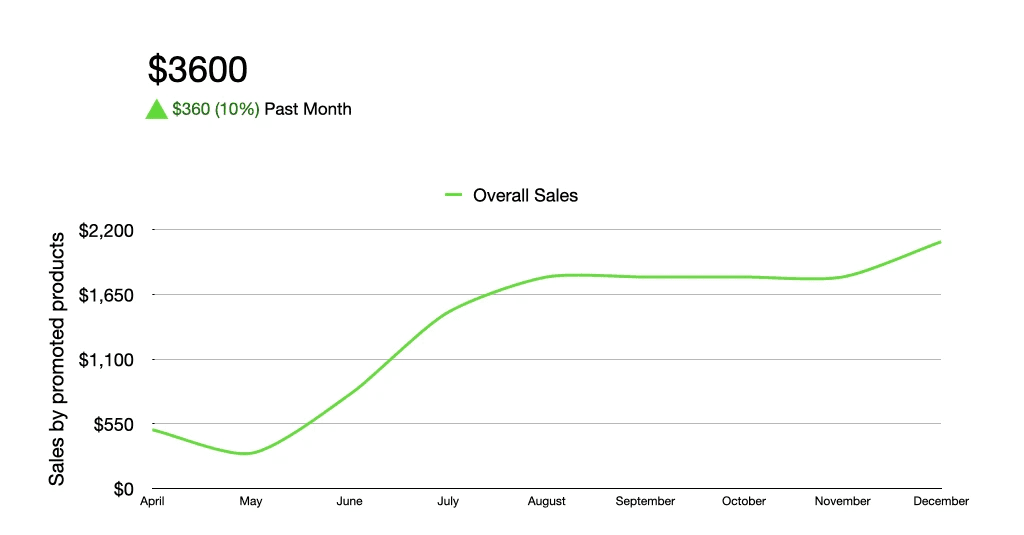
Sales graph attributable
to the Ads ran using
Tapestry AI.
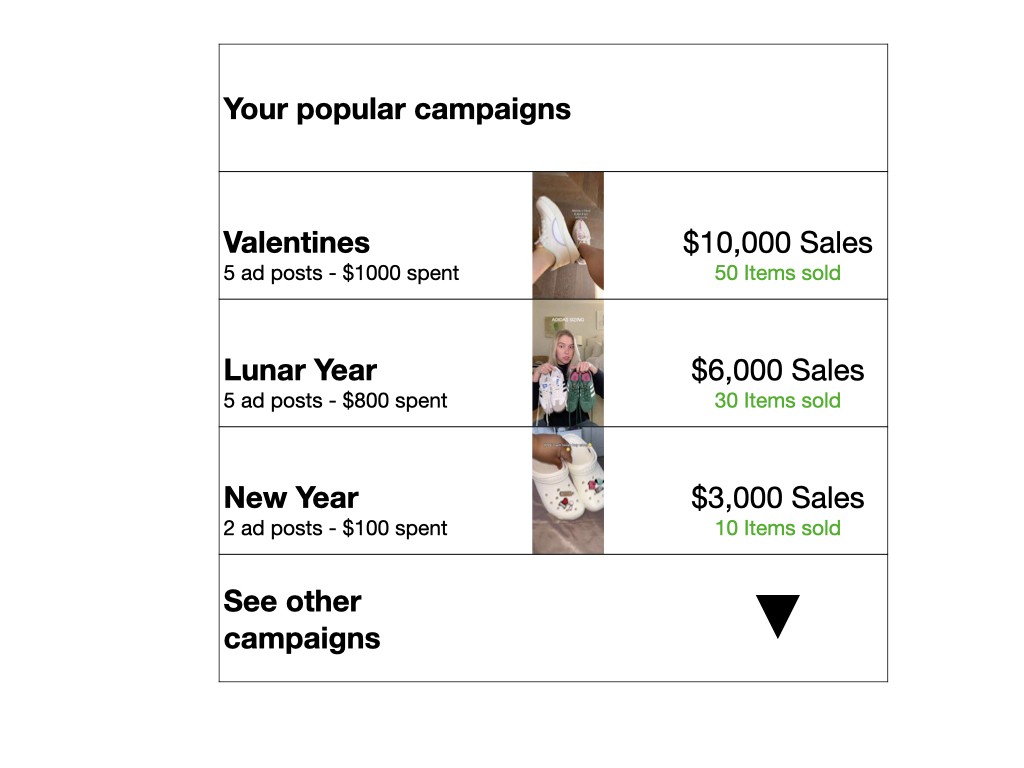
This graph should show how
campaigns resulted in sales
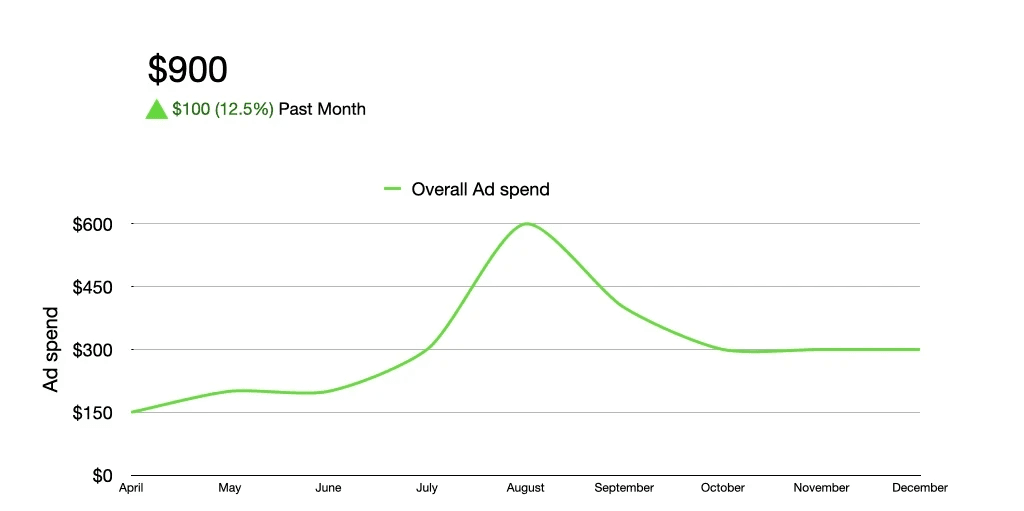
Shows Ad spend
and ROAS trends

Promote product reviews
Engagement rate: +12%
Total posts by competitors: 9

Funny Memes
Engagement rate: +12%
Total posts by competitors: 9

Evidence based
Engagement rate: +12%
Total posts by competitors: 9
Summer Trends
Engagement rate: +12%
Total posts by competitors: 9
Valentine's day
Engagement rate: +12%
Total posts by competitors: 9
